Note
Go to the end to download the full example code. or to run this example in your browser via Binder
An example with a plot#
This is just for testing.
import matplotlib.pyplot as plt
import oslumen as ol
import mplstyle_oslumen
import numpy as np

plt.style.use("oslumen")
A comment
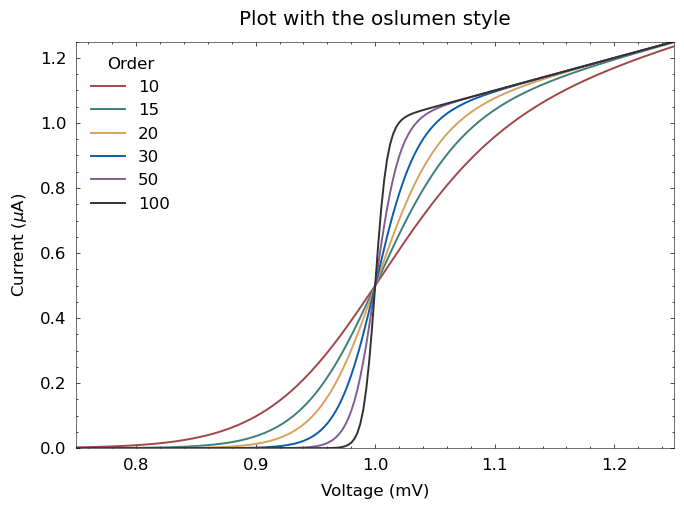
def model(x, p):
    return x ** (2 * p + 1) / (1 + x ** (2 * p))


pparam = dict(
    xlabel="Voltage (mV)",
    ylabel=r"Current ($\mu$A)",
    title="Plot with the oslumen style",
)

x = np.linspace(0.75, 1.25, 201)

fig, ax = plt.subplots()
for p in [10, 15, 20, 30, 50, 100]:
    ax.plot(x, model(x, p), label=p)
ax.legend(title="Order")
ax.autoscale(tight=True)
ax.set(**pparam)
plt.tight_layout()
A map
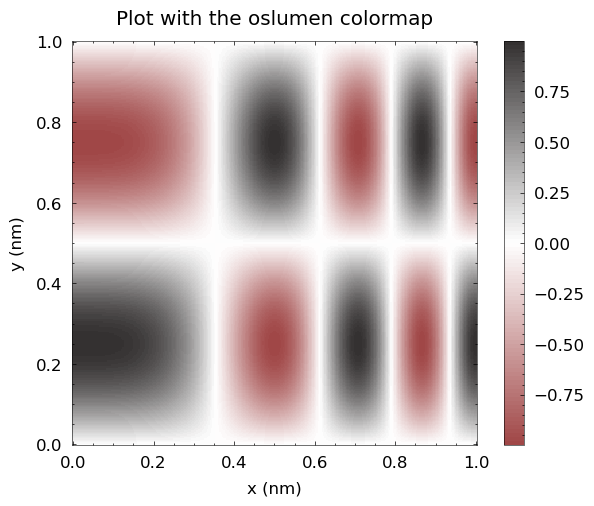
fig, ax = plt.subplots()
x = y = np.linspace(0, 1, 300)
x, y = np.meshgrid(x, y)
z = np.cos(4 * np.pi * x**2) * np.sin(2 * np.pi * y)
plt.pcolormesh(x, y, z, cmap="oslumen")
plt.xlabel("x (nm)")
plt.ylabel("y (nm)")
plt.title("Plot with the oslumen colormap")
ax.set_aspect(1)
plt.colorbar()
plt.show()
Total running time of the script: (0 minutes 1.039 seconds)
Estimated memory usage: 231 MB